Quick Start
Get started with OWL Watch in 5 minutes.
Step 1: Create a Project Profile
Before monitoring logs, create a profile so OWL Watch understands your project structure:
owl-watch study ./my-project
Output:
Profiling project: ./my-project
Detected: maven project with spring-boot framework
Source dirs: src/main/java, src/main/resources
Config dirs: src/main/resources
Test dirs: src/test

Profile saved: ~/.owl-watch/profiles/my-project.json
Check existing profiles:
owl-watch study --status
Step 2: Start Monitoring
Watch a log file with your project profile:
owl-watch ./my-project/logs/app.log --project my-project
Output:
Log file: ./my-project/logs/app.log
Project: my-project (spring-boot)
Model: llama3.2
Dashboard: http://localhost:8080

Waiting for errors...
Step 3: Open the Dashboard
Open http://localhost:8080 in your browser.
Stats Overview
The top of the dashboard shows error statistics:
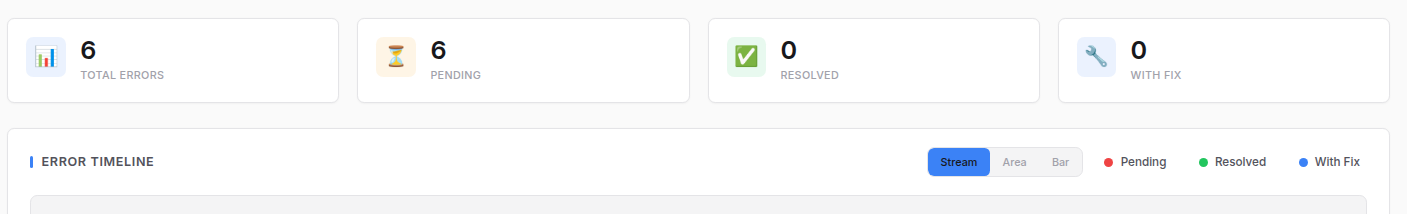
- Total Errors: All detected errors
- Pending: Errors not yet investigated
- Resolved: Errors marked as resolved
- With Fix: Errors that have a suggested fix
Error Timeline
The timeline graph shows error activity over time:
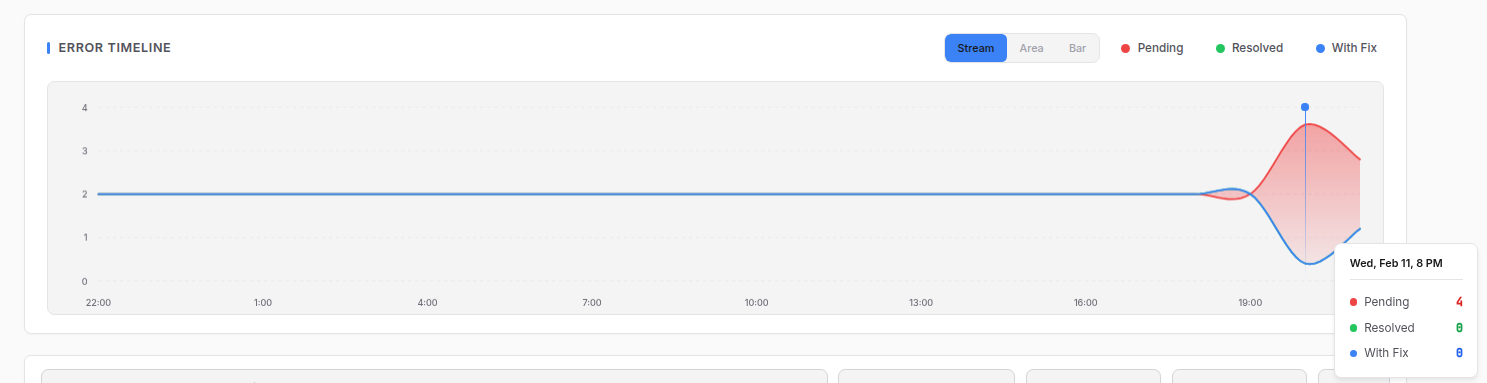
- Toggle between Stream, Area, and Bar views
- Hover to see counts at specific times
- Filter by Pending, Resolved, or With Fix
Error List
Below the timeline, you'll see the list of errors:
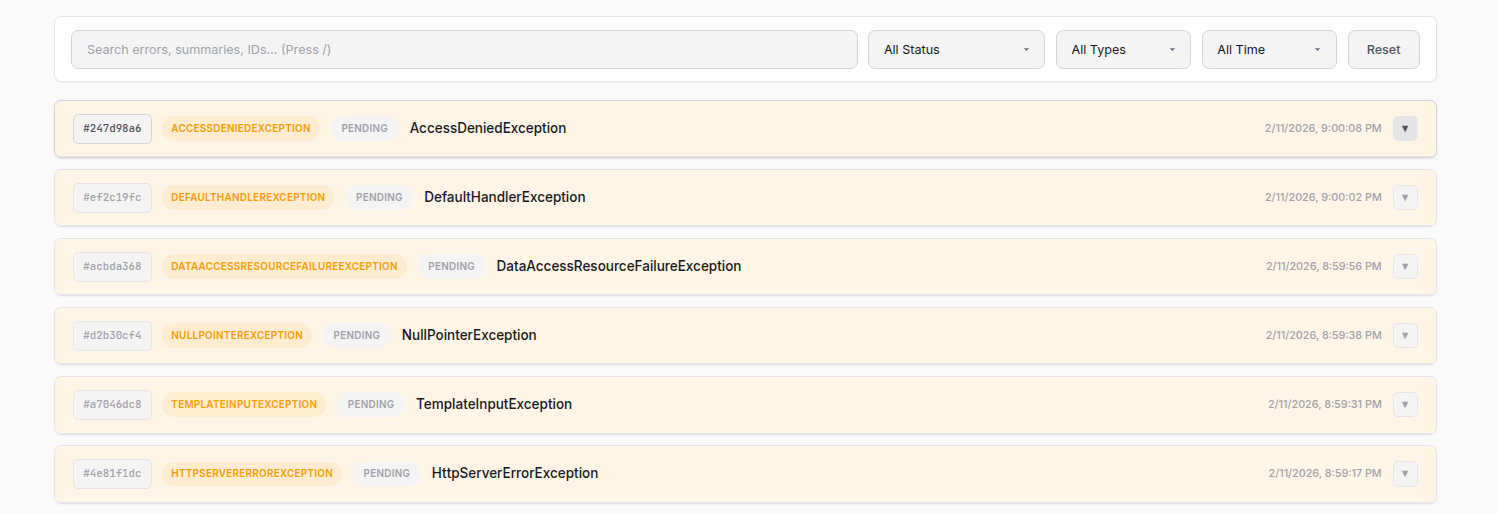
Each error shows:
- ID: Unique identifier
- Type: Error type (e.g., NullPointerException)
- Status: PENDING, INVESTIGATING, or INVESTIGATED
- Timestamp: When the error occurred
Use the filters to search and filter errors:
- Search: Search by error text, ID, or summary
- Status: All, Pending, Investigated, Resolved
- Type: Filter by error type
- Time: All Time, Last Hour, Last 24 Hours, Last 7 Days
Step 4: Investigate an Error
Click on an error to expand it:
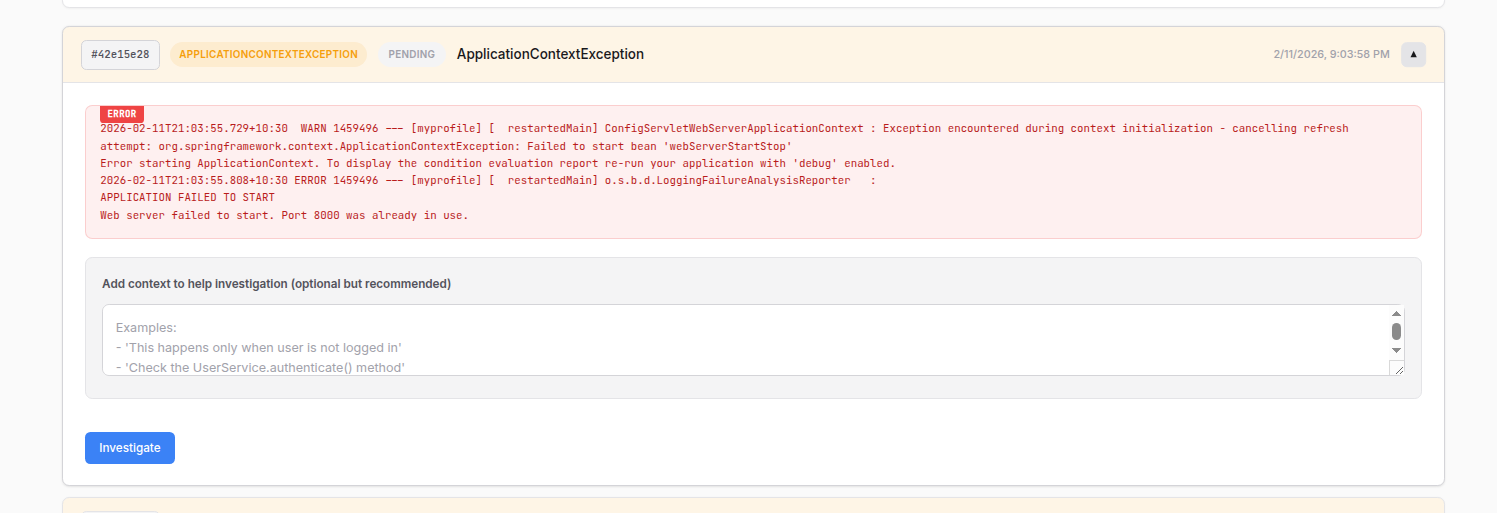
You'll see:
- The full error message and stack trace
- A text field to add context (optional but helpful)
Add any relevant context, then click Investigate.
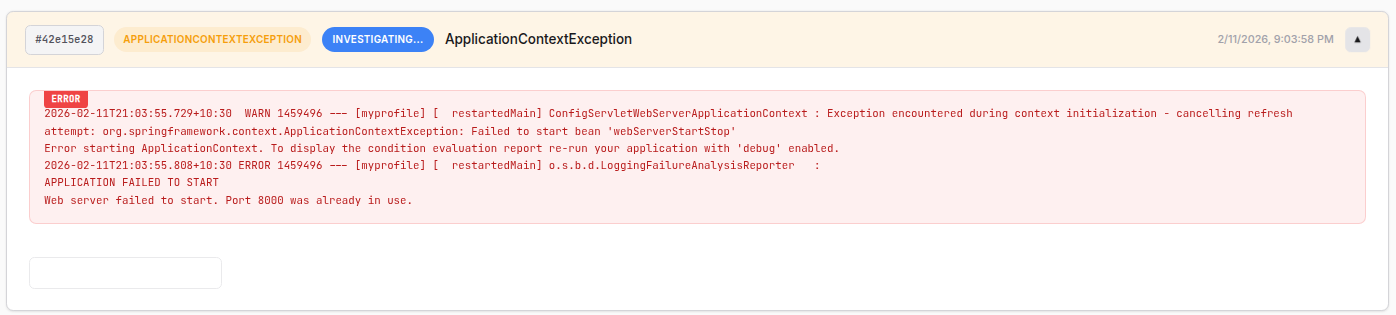
Step 5: View the Investigation
While the LLM analyzes the error, you'll see "INVESTIGATING..." status:
When complete, you'll see the full investigation:
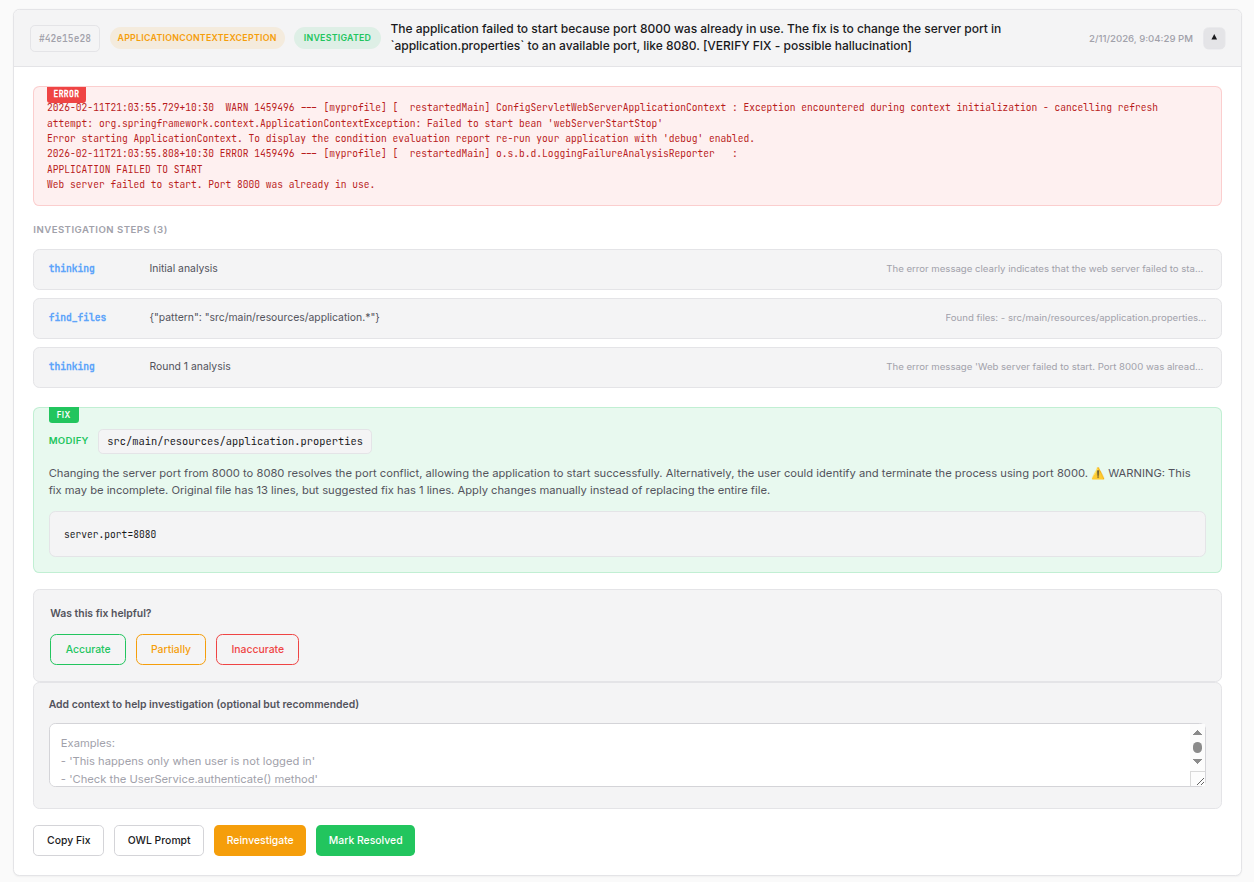
The investigation includes:
Investigation Steps
Shows what the LLM did to analyze the error:
- thinking: LLM's analysis reasoning
- find_files: Files the LLM searched for
- read_file: Files the LLM read
- search_code: Code searches performed
Fix Suggestion
The recommended fix with:
- Action: MODIFY, CREATE, or DELETE
- File: The file to change
- Explanation: Why this fixes the issue
- Code: The actual code to apply
Actions
- Copy Fix: Copy the fix code to clipboard
- OWL Prompt: View the prompt used for investigation
- Reinvestigate: Run a new investigation with different approach
- Mark Resolved: Mark the error as resolved
Feedback
Rate the investigation accuracy:
- Accurate: The fix was correct
- Partially: The fix was partially correct
- Inaccurate: The fix was wrong
CLI Options
| Option | Description |
|---|---|
--project NAME | Use a specific project profile |
--port PORT | Dashboard port (default: 8080) |
--model MODEL | Ollama model (default: llama3.2) |
--no-server | Run without dashboard (CLI only) |
-v, --verbose | Enable debug output |
Example Workflows
Spring Boot Application
# Profile the project
owl-watch study ./spring-app

# Monitor the log
owl-watch ./spring-app/logs/spring.log --project spring-app
Python Django Application
# Profile the project
owl-watch study ./django-app

# Monitor the log
owl-watch ./django-app/logs/django.log --project django-app
Using a Different Model
# Use mistral instead of llama3.2
owl-watch app.log --project myproject --model mistral
Custom Port
owl-watch app.log --port 9000
Keyboard Shortcuts
In the dashboard:
| Key | Action |
|---|---|
L | Switch to Live tab |
H | Switch to History tab |
R | Refresh data |
/ | Focus search box |
Next Steps
- Features - Learn about all dashboard features
- How It Works - Technical architecture