Features
Dashboard
Live vs History Tabs
The dashboard has two main views:
- Live: Shows the 50 most recent errors in real-time
- History: Searchable archive of up to 10,000 investigations
Switch between tabs using the tab buttons or keyboard shortcuts (L for Live, H for History).
Error Timeline Graph
The timeline visualization shows error frequency over time:
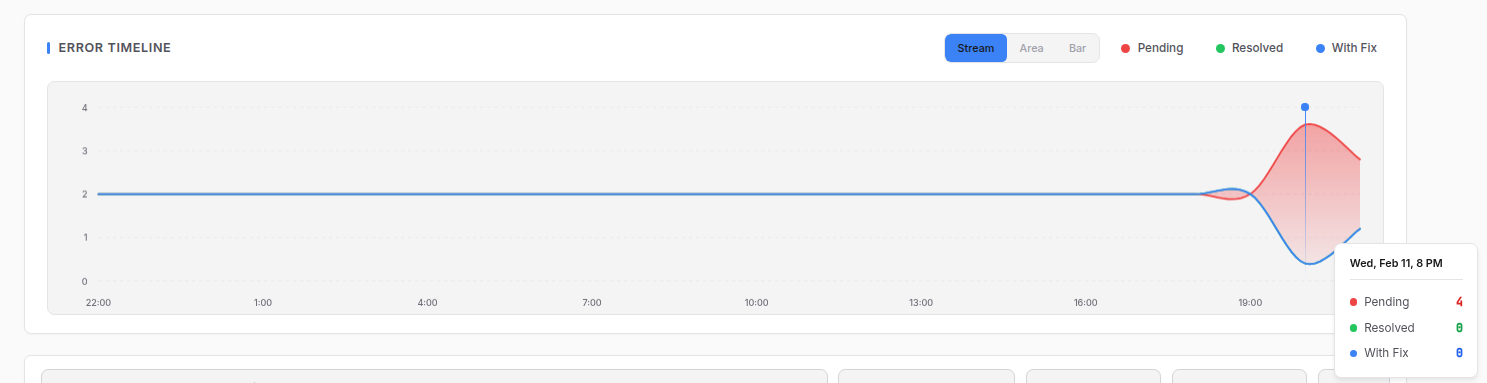
Graph Types:
- Stream: Flowing stacked area chart (default)
- Area: Traditional stacked area chart
- Bar: Grouped bar chart
Series:
- Pending (red): Errors awaiting investigation
- Resolved (green): Errors marked as resolved
- With Fix (blue): Errors with a suggested fix
Click the legend items to show/hide series.
Search and Filters
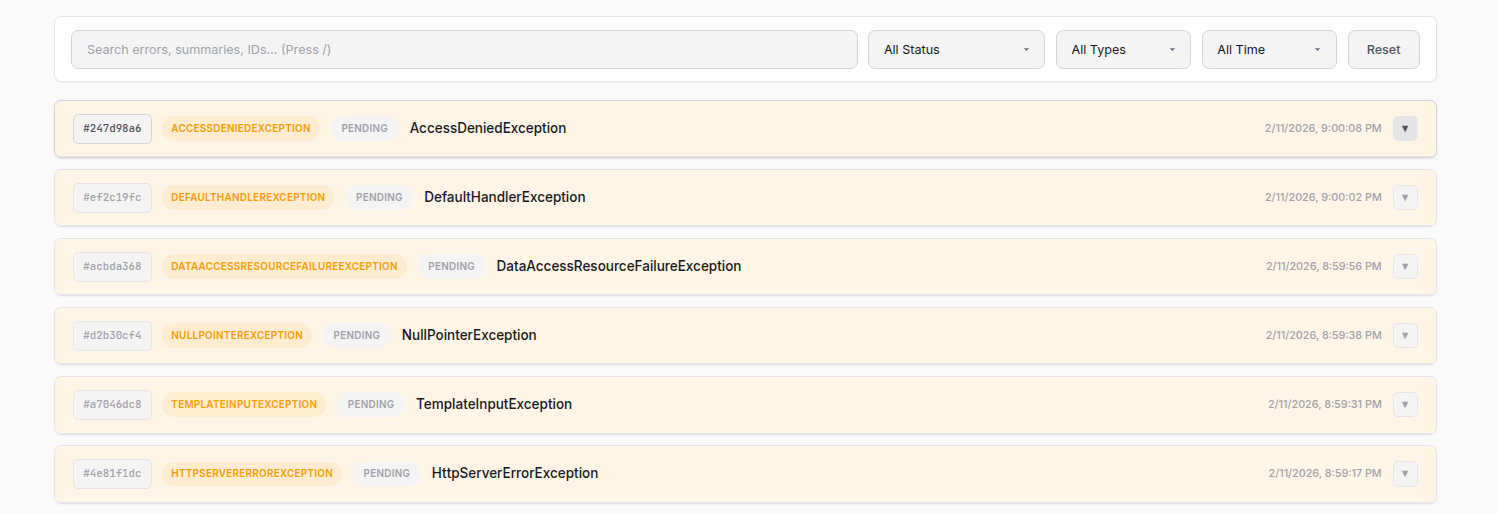
Search Box:
- Search by error message, ID, or investigation summary
- Press
/to focus the search box
Filters:
| Filter | Options |
|---|---|
| Status | All, Pending, Investigated, Resolved |
| Type | All Types, or specific error types |
| Time | All Time, Last Hour, Last 24 Hours, Last 7 Days |
Click Reset to clear all filters.
Investigation
Starting an Investigation
- Click on an error to expand it
- Optionally add context in the text area
- Click Investigate
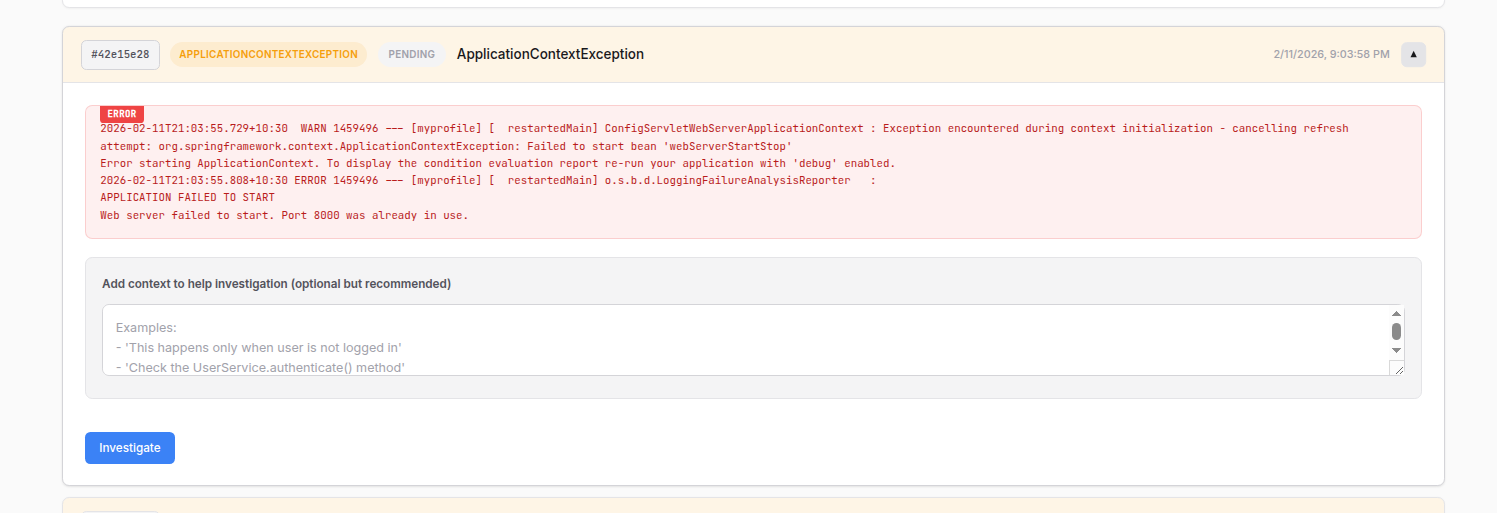
Adding Context:
The context field helps the LLM understand your specific situation. Examples:
- "This happens only when user is not logged in"
- "Check the UserService.authenticate() method"
- "This started after we upgraded Spring Boot"
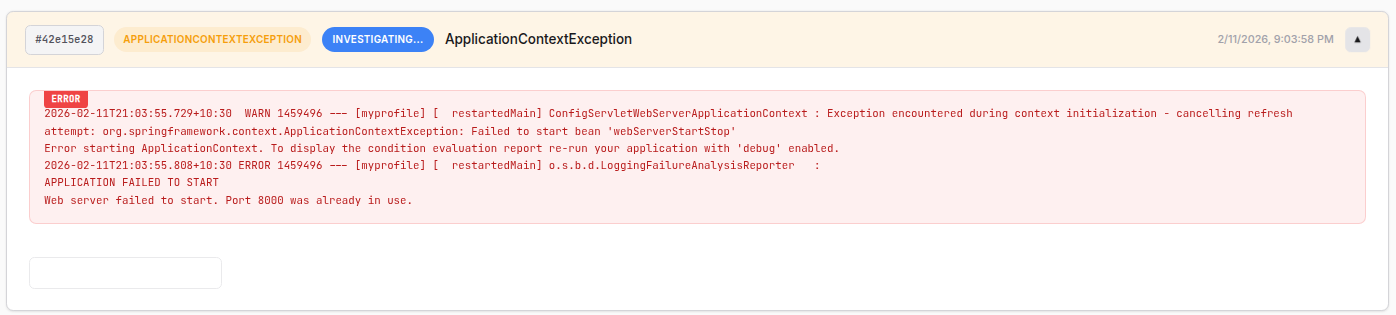
Investigation Process
When you click Investigate, the LLM:
- Analyzes the error message and stack trace
- Searches your codebase for relevant files
- Reads source files to understand the code
- Iterates up to 3 rounds to find the root cause
- Suggests a fix with explanation
Investigation Results
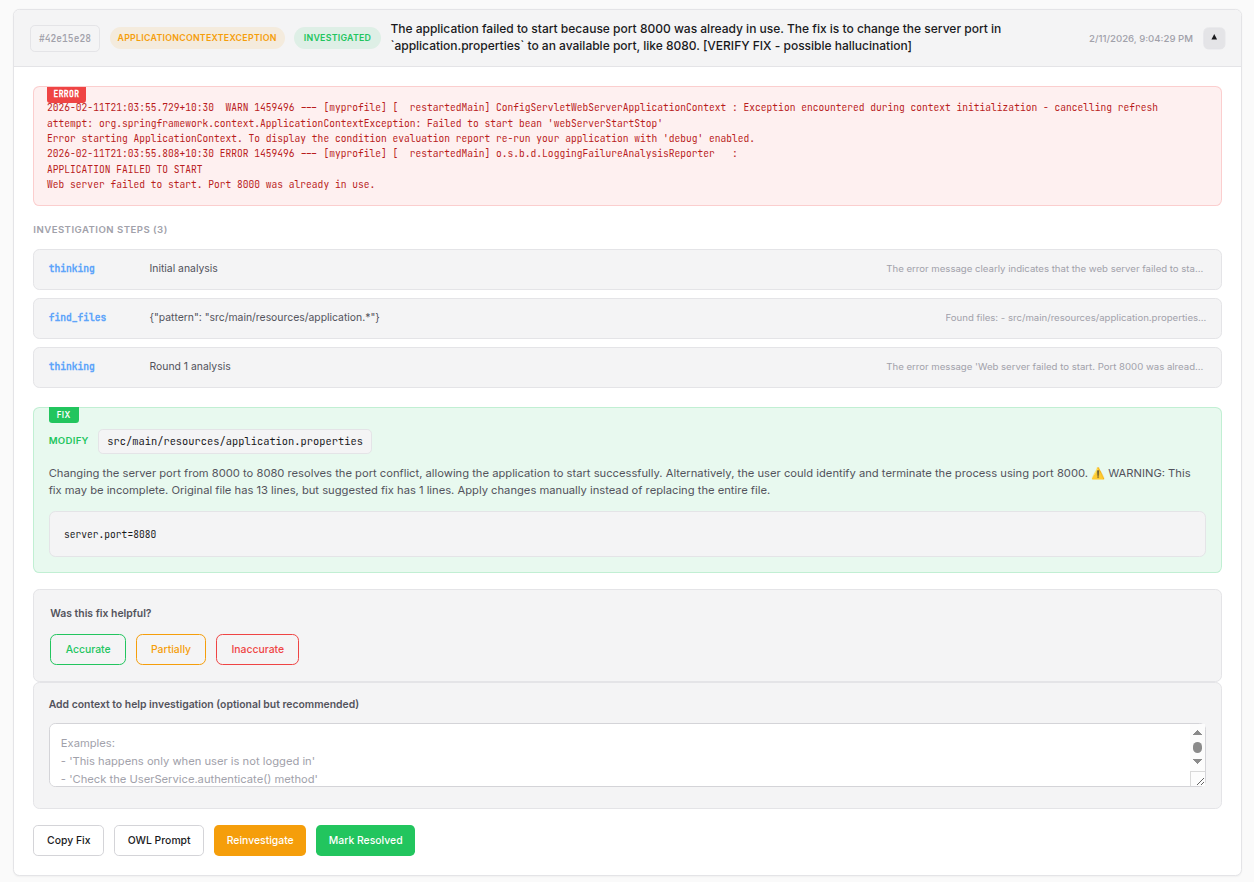
Investigation Steps:
Shows the LLM's reasoning process:
| Step Type | Description |
|---|---|
thinking | LLM's analysis and reasoning |
find_files | File pattern searches (e.g., *.java) |
read_file | Files read for context |
search_code | Code searches for specific patterns |
list_dir | Directory listings |
check_exists | File existence checks |
Fix Suggestion:
The fix includes:
- Action: What to do (MODIFY, CREATE, DELETE)
- File: The specific file to change
- Reason: Why this fixes the issue
- Code: The exact code to apply
Warning Messages:
If the fix might be incomplete, you'll see a warning like:
"WARNING: This fix may be incomplete. Original file has 13 lines, but suggested fix has 1 lines."
This helps you know when to review the fix carefully before applying.
Reinvestigation
If the first investigation didn't find the right fix, click Reinvestigate:
- The LLM explicitly avoids the same files it already checked
- It looks for alternative causes
- It tries a different approach
OWL Prompt
Click OWL Prompt to see the exact prompt sent to the LLM. This is useful for:
- Understanding what context the LLM received
- Debugging investigation issues
- Learning how the system works
Feedback System
Rate investigation accuracy to track quality over time:
| Rating | When to Use |
|---|---|
| Accurate | The fix correctly solved the problem |
| Partially | The fix was on the right track but incomplete |
| Inaccurate | The fix was wrong or irrelevant |
Feedback is stored and can help improve future investigations.
Webhook Alerts
Send error notifications to Slack, Discord, or any webhook endpoint.
Configuration
In ~/.owl-watch/config.json:
{
  "alerting": {
    "webhook": "https://hooks.slack.com/services/YOUR/WEBHOOK/URL",
    "severities": ["critical", "high"],
    "cooldown": 300
  }
}
Options
| Option | Description |
|---|---|
webhook | The webhook URL to POST to |
severities | Which severity levels trigger alerts |
cooldown | Seconds between alerts for the same error type |
Payload Format
Alerts are sent as JSON POST requests:
{
  "error": "NullPointerException at UserService.java:42",
  "timestamp": "2024-02-11T21:00:00Z",
  "severity": "high",
  "investigation": {
    "summary": "Missing null check in getUserById",
    "fix": "Add null check before accessing user object"
  }
}
Project Profiles
Profiles help the LLM understand your project structure.
Creating a Profile
owl-watch study ./my-project
What Profiles Detect
| Detected | Examples |
|---|---|
| Project type | maven, gradle, npm, python, go, rust |
| Framework | spring-boot, django, flask, express, react |
| Source directories | src/main/java, src, lib |
| Config directories | src/main/resources, config |
| Test directories | src/test, tests, tests |
Viewing Profiles
owl-watch study --status
Shows all profiled projects with their detected types and frameworks.
Profile Storage
Profiles are stored as JSON in ~/.owl-watch/profiles/<name>.json.
Rate Limiting
The dashboard includes built-in rate limiting:
- 60 requests per minute per client IP
- 3 concurrent investigations maximum
This prevents accidental overload of the Ollama service.
Keyboard Shortcuts
| Key | Action |
|---|---|
L | Switch to Live tab |
H | Switch to History tab |
R | Refresh data |
/ | Focus search box |
Esc | Close expanded error |
Next Steps
- How It Works - Technical architecture and data flow